
Customer acquisition metrics are the second category of startup performance measures closely associated with product engagement. As your venture moves from your early product testing to product launch, you shift your focus from customer engagement to customer acquisition. In the early MVP iterations, you are not interested in the acquisition, only engagement. In fact, in most cases, it is an excellent startegy to constrain the number of potential customers actively engaged with your product as it evolves. Once you know that you have, say, one hundred customers that are continuously using your product and are already recommending it to others, you are ready to focus on acquisition. The metrics you focus on are very much associated with the stage of your product’s development. For example, you step from activity to stickiness to virality in most business models. Only then do you lean into acquisition and retention.
For this post, we will explore standard metrics that demonstrate that you are gaining traction in terms of rate customer acquisition and retention. These measures include vital startup indices associated with your sales funnel, from lead generation to retention (and inevitable attrition). As stated above, you will generally focus on specific metrics as you transition from one stage to another. Moving a customer down the sales funnel is a dynamic process, with plenty of variables to consider and much experimentation to come.
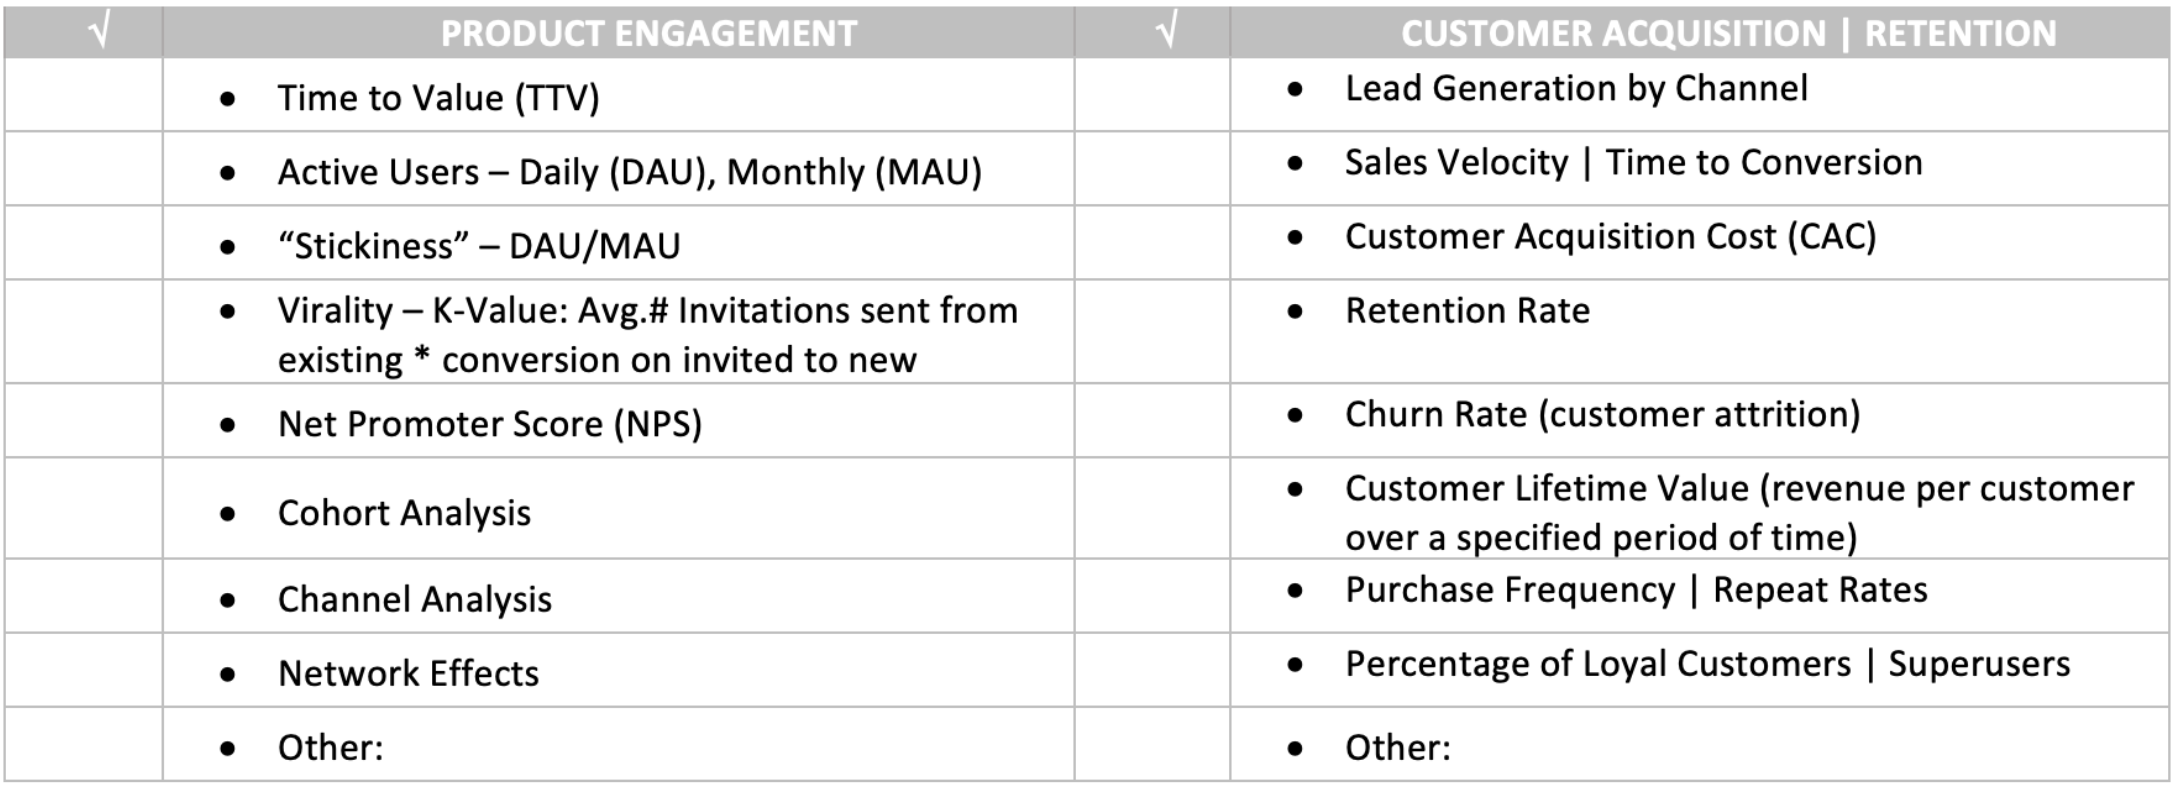
Channel Analytics | Lead Generation
If we have learned anything from the impact that changes in in-app tracking have had on customer acquisition, it is don’t put all your eggs in one basket. Measuring and monitoring where your customers come from regarding marketing channels is an important area. As founders know, marketing costs are one of the critical expense areas for startups. You want to watch customer traffic for each separate channel activity. Starting with lead generation, founders should monitor activity throughout the sales funnel. How many leads are you generating per channel? As mentioned in an earlier post on pre-launch metrics, you can collect early data on the efficacy of specific channels during the customer discovery and MVP process. Which channels are yielding the most engaged early customers?
In addition to lead generation, you continue to monitor costs to acquire a customer and overall conversion rates for each channel. Each lead generation channel yields different results. Additionally, you should differentiate channel activity into direct and indirect. For example, are customers coming to your physical location or website directly or through intermediaries. What are the measurable differences between customers coming to you through paid channels versus unpaid “organic” sources?
The bottom line is that you should be experimenting and measuring results for each channel, breaking down the numbers for each phase of the sales cycle. You do this analysis by customer segment and by cohort to monitor differences and changes.
Time to Conversion
As we have stated, measuring and monitoring your customer sales cycle is crucial to early startup traction and growth. One of the essential sales cycle metrics measures the time it takes for a new lead to decide to purchase your product. You must understand each sales cycle phase for your particular business model and customer type. For example, B2C enterprises’ time to convert a new customer can vary from seconds (an Amazon one-click purchase) to weeks (a new car transaction).
This metric is vital for B2B companies. The average sales cycle for enterprise transactions can be lengthy due to many factors. For example, such factors as multiple contact points, the time between each contact, and the overall complexity of the procurement process can extend the sales cycle. Therefore, B2B founders must measure and monitor each step in the cycle to reduce the time at each point.
Another related metric, sales velocity, measures the number and speed of new customers acquired during a specific period. This metric is sometimes called pipeline velocity. This metric adds the number of new opportunities in the pipeline along with the time to convert them. The typical formula includes the number of opportunities in the pipeline multiplied by the average purchase value times your average conversion rate, all this divided by sales cycle length. You need to have enough sales history for this metric to become meaningful. It is essential to set up a spreadsheet for pipeline analysis and keep track of the timing of each transaction.
Customer Acquisition Costs
Most appropriate for startups is measuring and monitoring the costs associated with new customer acquisition. The cost of customer acquisition (CAC) is calculated as total marketing and sales expenses divided by the number of new customers. However, several factors founders should consider when calculating CAC. First, calculate marketing expenses with a bottom-up approach, where one considers the cost of each promotional channel separately and then aggregates it into a final cost total. Then, if you plan to reach and acquire new customers using specific promotional channels, you can estimate how many customers you will reach and convert for a specified budget amount.
A standard method to support COCA estimates in calculating your “funnel math.” Basic process: Estimate revenue goals divided by product/service price. This calculation gives you the number of customers you need to purchase the product. Once you know the number of customers required to meet your revenue goals, you apply industry-standard conversion rates (this will take some research). The funnel labels depend on the industry, but opportunities – qualified leads – prospects – are standard labels.
For example, if you plan to reach customers using Google Ads, you set a budget and track how many customers visit your website and then how many of those visitors purchase your product. From this information, you can determine your conversion rate for this particular promotional channel and the percentage of total visitors to your site that become paying customers. For example, if 10,000 people visit your site from a specific Google Ad campaign and 500 customers buy your product, the conversion rate is 5 percent. Once you know how much you want to spend on the customer acquisition campaign, you can estimate and monitor new customers per the funds expended. For example, if your ad campaign costs $23,200 to reach 10,000 potential customers ($2.32 per click) and you acquire 500 customers, your COCA is $46.40.
Estimating and monitoring COCA is one of the most critical metrics for most startups as it drives revenues and is most likely one of your highest costs. Therefore, it is a vital metric to track.
Customer Lifetime Value
Customer lifetime value (CLV) is a critical metric for most business models. This metric and conversion and churn rates can tell much of the story behind your venture’s performance. CLV indicates the total revenue you expect a single customer to generate over their predicted lifespan. The longer a customer continues to purchase goods and services from your venture, the greater their value.
To calculate CLV, you need to make several underlying assumptions, especially early in your venture growth phase. The first variable to estimate is the average purchase value for your customers. Depending on the business type and product offerings, this can be as straightforward as dividing the total company’s revenues by the number of customer purchases over a specific period. From here, you estimate the average frequency rate, in other words, how many purchases are made over the same period divided by the number of unique customers who made purchases in the same period. Now you can generate a baseline customer value for the period in question. You do this by dividing the average purchase value by the average purchase frequency rate.
Once you have the average customer value, it is time to estimate the length of time a customer continues to make purchases from your venture. The length of time varies depending on your business. It can span from a one-time transaction to purchases for several years. When you have historical data, you can quickly insert the actual average length of time a customer continues to purchase from your company. If you don’t have a history, as is most likely the case for an early venture, you will have to make some assumptions. These assumptions can come from industry benchmarks or comparative data from similar products. The final step is calculating LTV by multiplying customer value by the average customer lifespan. These steps give you a reasonable estimate of how much revenue you can expect to form from your average customer throughout their relationship with you.
The above approach is the simplest form of LTV calculation. There are more complex or customer methods depending on your business and the goals of the analysis. In any event, there are plenty of nuances to consider.
First, the general calculation above creates an inflated value for your customer. Looking at revenue without associated variable costs provides a current or short-term value statistic. A better method is the estimate CLV after accounting for customer acquisition costs (CAC). Next, you take the average revenue per customer -any variable costs associated with the sale. Depending on how you define your variable expenses, you are measuring the net contribution of each customer. Then, you take the average life span of the customer for a specific period of months. You should add your monthly churn (see below) into the equation to better estimate the average customer life span.
Using this more conservative approach, you determine your CLV by multiplying the customer contribution margin by the average lifespan of the customer. This approach can give you a better baseline to determine how much to spend on customer acquisition and the payback period.
As with most customer-associated metrics, your results will vary for different customer segments. Founders should consider breaking down the customer “averages” by segment, thus calculating separate LTVs. This information helps to form your customer acquisition strategy by segment, facilitating an understanding of how much you want to spend for specific customer types. As mentioned later, you may want to spend more on customer segments with historically higher purchase values.
Retention | Churn Rates
Under the customer metrics category, there are two other vital performance measures to monitor, primarily if your revenue model relies on repeat purchase rates or recurring payments, such as gym memberships or software subscriptions. In addition, if your business model relies on repeat customers, you will want to monitor customer retention rates or, the opposite, attrition rates (sometimes referred to as customer churn rates).
You calculate and monitor these metrics based on the most relevant period for your business model. For example, if customers pay monthly fees, you will want to watch the percentage of customers that continue to pay recurring fees. From the loss of customer perspective, you can calculate the monthly customer “churn” as follows: customers at the beginning of the month minus those remaining at the end of the month divided by the number of customers at the beginning of the month. Example: 100 customers at start minus 95 at end/the 100 starting = 5 percent churn rates for that month. Other churn-related calculations include Annual Churn Rate, Revenue Churn rate (applicable if you have a different level of paying customers), and Net Revenue Churn (Churned Revenue minus New Revenue/Total Starting Revenue).
While churn rate is essential for businesses with recurring revenue models, it is critical to understand no matter what the industry. Customer churn manifests in several ways. In a recurring revenue model, churn occurs when a customer ends or opts out of a subscription. In non-recurring revenue business models like services or retail, customers discontinue service contacts or stop visiting your shop. Customers can stop purchasing your products. In any of these scenarios, monitoring your churn rates and evaluating whether they align with your industry and business model is vital. Founders should compare churn with industry benchmarks and any internal historical trends. Industry/product category benchmarks may be helpful, but be wary of different ways of calculating, categorizing, different standards such as timing, etc.
Additionally, it is wise to put in place a protocol to conduct exit interviews with customers who no longer use your products. You can gain actionable data from talking to customers about their experience with your product and company. For example, you may find their dissatisfaction with some aspect of your product’s performance or a poor customer service experience. In addition, these interviews provide a direction to facilitate a reduction in churn rates. Several tools can help with this exit interview process, from customer relations management (CRM) software to customer journey analytics platforms to online surveys.
On the other side, you want to understand which customers are leaving and why. Assessing how much customers leave is worth to the company is essential. When you look at “churned” customers, evaluate how much they spend and on what products? Are you losing customers with high purchase repeat and frequency rates? Or are low spenders the ones leaving. You don’t want to lose any customers, but understanding how much they are worth allows you to determine how much to spend on retaining them. Once you know which customers are leaving and why you can choose a cost-effective strategy to keep them.
Retention marketing must be part of a startup’s strategy (new customers cost 5 to 10 times more than retaining existing ones). By increasing customer retention, you will lower your customer acquisition costs. In general, if customer acquisition does not outpace your churn, you are headed towards a slow down in growth. If your acquisition rates don’t continue to increase and churn remains the same, growth starts to flatten out.
Repeat Purchase Rates | Purchase Frequency
A couple of metrics also provide early indications of customer retention. The first one, repeat purchase rate (RPR), measures the percentage of customers purchasing your product more than once. RPR works well with any business model where increasing repeat customers generates growth. For example, E-commerce sites, subscription services, and business contract renewals are all candidates for this metric. You calculate RPR by dividing the number of customers who have purchased more than once by the total number of customers. This method is a quick way to analyze customer purchase trends. Similar to other metrics, you can monitor this metric by segment and cohort.
A second leading indicator of customer retention is purchase frequency. This metric measures the number of times your customer purchases your products during a specific period. One calculates purchase frequency by dividing the number of purchases made during a particular period by the number of unique customers. It is crucial to count customers only once for this measure, regardless of the number of transactions made during the defined time frame.
These two metrics provide insight into your customer’s purchasing behavior, allowing you to take specific actions to increase repeat business. In addition, both measures offer another perspective on customer retention and are leading indicators of lifetime value. If your customer visits your store or website frequently, buying often and repeatedly, you start to see the value the customer places on your products and services.
Loyal Customer Rate
One metric that indicates the customer’s view of your product’s value is a measure of loyalty. You can define customer loyalty in different ways, and it very much depends on your business. Most businesses look at the most significant percentage range of highly active users and frequent, repeat customers. The percentage range varies from 5 to 20% of your customer base. Again, you can check industry benchmarks for guidance. Next, you want to determine how much revenue is coming from your top customers. If you generate most of the income from the top percentage of customers, you can adjust retention strategies to capitalize on these top purchasers. Additionally, there is a high probability that these customers are your foremost advocates, so you want to find unique ways to engage them and encourage their ambassadorship.
Analytic Frameworks
A couple of things to keep in mind on these product and customer engagement metrics is ensuring that your definitions are clear. You must remember the time period, cohort, segment, etc.
In general, when measuring and monitoring product and customer engagement, there are several factors to consider. The first factor to consider when deciding which metrics to apply to your business is the element of time. When you look at the demographics of your target customer, you want to keep in mind factors such as period interval, age of your business, and customer cohort. Contextually, you always want to keep in mind what is going on during the period that you are measuring performance. When comparing your product’s performance and customer behaviors, you must remember what happens during each period. Nothing has made this clearer than watching venture actions and performance before, during, and later pandemic periods. For example, if you own a brick-and-mortar retail business and apply “foot traffic” metrics to monitor the success of new product introductions or promotional campaigns, the analytics would demonstrate quite a difference in performance. You would have to put these numbers in context with what is happening during each phase of the pandemic. Additionally, as you scan a period, you will have made many strategic products and operational decisions that will most likely influence your metrics. So defining the period is a critical part of understanding performance over time.
A second element to consider is the age of your product. How long has it existed, from early MVP to current status? New products are rarely static and evolve with new features and innovations, generating different user experiences. As a result, customer experience and associated metrics will most likely be quite different. For example, if you are measuring metrics like time to acquisition or value, you might see a flattening out of improvements as the product reaches a later stage in its life cycle. At the same time, you may see vast improvements in customer retention metrics as product innovations continue to enhance user experience.
A third element to keep in mind when creating your metrics strategy is looking at cohort behavior. In this context, you define a cohort as a group that starts to use the product at the same time. All customers that start using a product simultaneously similarly experience its evolution. There are many advantages to following an individual cohort through their product use. When you apply specific metrics to a cohort, you create a robust profile of the cohort. So if you follow the cohort for a particular period, you will clearly measure their use patterns and purchasing behavior. You will have an exact measure of their “lifetime value,” at least up to a specific point in time. Cohort analysis is an essential practice to measure changes in product engagement.
As you may suspect, best practice dictates that you apply some combination of these three approaches as you create your measurement strategy. In a sense, they are all interrelated. For example, if you take a defined period and know how long the customer has been using the product, you can identify the cohort. These interrelations ships are helpful and allow you to look at product activity and customer behavior from different perspectives. It also enhances your measurement and monitoring results, as each approach has advantages and disadvantages. For example, cohort analysis has the benefit of measuring the same population over time. It allows you to consider changes in behavior as the product evolves, controlling for any changes within the period, such as economic or social changes. However, cohorts can also differ in behaviors due to segmentation. For example, you may have a cohort that all started to use your product simultaneously, but cohort membership represents a wide variety of ages or some other demographic. Therefore, you must consider any integral demographic variation in your analysis. In addition, you will need much larger sample sizes to be able to evaluate a cohort, further divided into segments.
Next Up
In the final installment of our startup metrics series, I will address various financial performance indices that founders should be measuring and monitoring. These post-launch metrics focus on revenue generation, profitability, and funding. Finally, the post will highlight the “One Metric that Matters” and its relevance to new venture realization.
Facebook | Instagram | LinkedIn | Twitter
© 2022 Venture for All® LLC. All rights reserved.
