
As we continue to explore the various elements of financial planning for startups, it is time to look at the multiple ways you can measure and monitor your performance once you launch your venture. In a previous post, I outlined several pre-launch metrics that founders should consider monitoring as they develop their business model. These pre-launch metrics are customer engagement, minimal viable product (MVP), profit model, resource acquisition, and critical path. You will see that our post-launch metrics build on these categories. During that article, I outlined what makes a good metric – actionable, quantifiable when possible, testable & causal, and comparative. All these attributes apply to our post-launch metrics as well. While there is undoubtedly some overlap between pre and post-launch metrics, the main difference is that you are transitioning from projected data to actual results. As a result, a founder may need to monitor several other potential metrics or key performance indices (KPIs). I break these post-launch metrics across five categories: product, revenue, customer, profitability, and funding. For this post, I will focus on the first two metric categories: Product Engagement and Customer Acquisition.
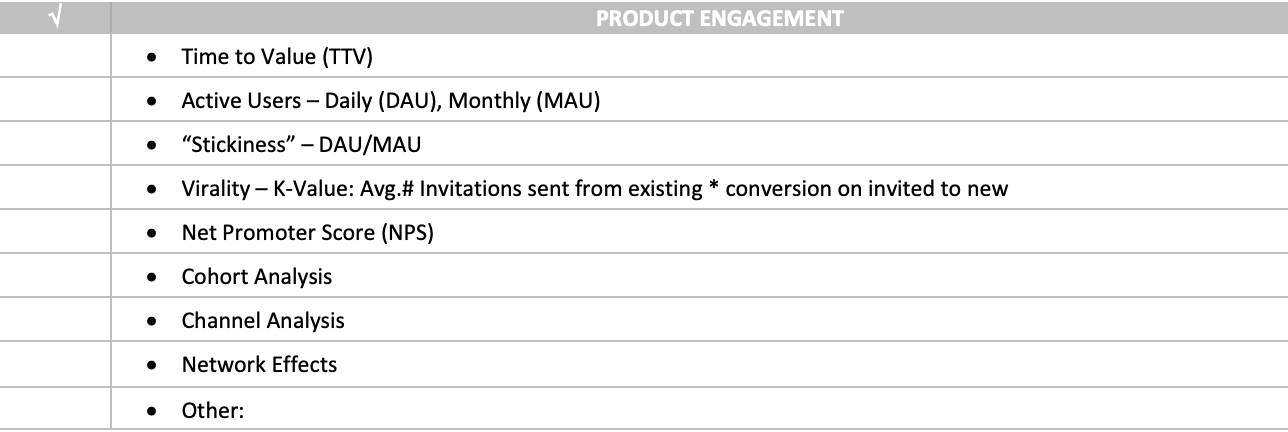
Product Engagement Metrics
During the pre-launch MVP stage, you focus on measuring how the customer engages with the product and the offered features. Do you want to monitor whether your customers are using the product? How are they using it? Are specific features being used over others? In other words, the focus is on customer engagement with your solution. As you continue to reiterate, you will measure increases (or decreases) in usage, retention, churn, and overall satisfaction. You should be monitoring these metrics throughout each iteration, watching for changes in behavior as you introduce new features and eliminate others. You will also want to compare customer segments and iteration cohorts. Are you seeing differences between different types of customers? Does engagement change based on when a cohort of customers entered the testing phase? Before transitioning from an MVP to a marketplace offering for sale, you want to ensure that your early customers are using the product regularly to solve the problem in question or in support of the job to be done.
Time to Value (TTV)
One of the metrics that founders should consider during this transitional phase from MVP to product launch is sometimes called the Time to Value (TTV) metric. Generally, one defines this metric as the time it takes for the customer to understand and benefit from the value of your solution thoroughly. This metric is typically for software products but has value for any product where onboarding activity is required. During the MVP phase of product testing, you should learn as much as possible about how much effort and time it takes to educate the customer about a product’s features and benefits. Onboarding activities can take many forms, including product demonstrations, tutorials, user manuals, integration with existing customer technologies, and data population support.
As you move your product into the marketplace, you want to monitor the effectiveness of your onboarding activities, looking to shorten the time it takes for the customer to optimize your product’s value. Unfortunately, time to value is a leading indicator of customer churn. Customers who find onboarding challenging will consider dropping the product and looking for alternatives in the marketplace. If onboarding is an integral part of product adoption, there are several strategies to make the process seamless and prevent customer attrition. Strategies range from design elements that make product use more intuitive to phasing in the adoption of product features, enabling the customer to graduate from one level of service to the next. Often, this phase-in approach is linked to pay plans offering additional features, guiding the customer towards greater value as they enroll in an advanced program.
Active User Metrics
When your MVP has transitioned into a functioning product, your attention shifts toward customer acquisition and growth, and founders start to focus on this prematurely. They accelerate their efforts to gain new customers at the expense of ensuring that their product is meeting current customer needs. I address new customer acquisition and retention in the upcoming customer metrics article. Monitoring and measuring the customer’s engagement with your product is essential. Focusing on product engagement facilitates product improvements and future innovations, which will lead to growth.
Post-launch product metrics vary depending on the type of offering. For example, measuring SAAS products will be different than physical consumer products. However, the principles are the same. First, you want to measure how engaged your customers are with your solution. There are several methods to measure engagement, starting with some form of active user data.
Active users may be defined in several ways depending on the product category. First, you must determine what you mean by active so that the interpretation of the data is clear. For mobile apps, websites, and social networks, you want to monitor unique users’ activity – usually measured as daily (DAU), weekly (WAU), and monthly (MAU) active users. The ratio of DAU/MAU will give you a sense of the “stickiness” of your product. For a coffee shop, you will also want to measure the number of unique customers who visit each day and how often they return during the month. Many customer measures work together with these active user metrics to enhance your understanding of the customers’ behavior.
Active user metrics meet the comparative criterion as an effective metric. There are several valuable comparisons by segment, channel, and time. You can collect active user data for each segment and channel and look at the month-to-month changes and a more normalized trailing six-month average. Of course, you can also compare projected to actual results or against industry benchmarks.
Net Promoter Score
Once the product is in the marketplace, and you have a growing number of active users, you want to gauge what percentage of these customers are likely to recommend the product to others. The Net Promoter Score (NPS) is one way to measure this. NPS measures the number of loyal customers most likely to recommend your product or service. The typical approach is to ask customers to rate your product on a scale of 0-10. Customers ranking the product in the lower ranges are detractors, those in the middle neutral, and those giving you a 9-10 are promoters. The NPS score = percent of promoters minus percent of detractors. Research shows that NPS is a leading indicator of organic growth.
The NPS score measures the customer’s stated intention to recommend your product. However, founders should favor metrics that illustrate actual behavior. For example, product adoption rates in relation to the number of users show viral growth. Virality measures the average number of new users a single customer can contribute to your customer base.
Virality Metrics
A standard product engagement metric is virality, the speed at which a product spreads from one unique customer to another. This measure is more robust than NPS because it measures actual behavior instead of intention to act. You calculate this by counting the number of invitations your existing customers sent and the conversion rate of invited new users. Commonly called the k-value, you start with your total number of current customers and the average number of invitations sent out per user. Then for a specified period, calculate how many of the invited users converted to the measured necessary behavior, such as paid subscriptions. So if you have 10,000 current customers, and each sends out ten invitations on average, you will have invited 100,000 potential new customers. If 10 % convert to paying subscribers, you will have 10000 converted customers or 20,000 customers. 10000 divided by 10 000 equals 1. A k-value of one or above is considered viral. The higher the virality rates, the lower your customer acquisition costs.
It is important to remember startups can enhance that product virality rates in several ways. You can design the product so there is an inherent virality designed right into the fabric of the solution, for example. OpenTable’s design is intended to share and invite others to a restaurant, thus encouraging non-users to sign up. Incentive virality is another approach to facilitate invitations to new users bu current customers. Another method may be called incentive virality. Active users receive rewards for bringing in other users. So you get a discount on your next purchase if you bring a new customer. Measuring this metric depends on several things, including the type of virality, the sales cycle, and the extent of your existing customer networks. What is essential about this metric is that if you can measure it, you can find ways to increase it through design or incentives. For example, suppose you know what a leading metric is to enhance virality, such as making it easier to invite friends. In that case, you can apply growth hacking experiments to see what will increase new user conversions.
For this reason, identifying leading metrics that predict future action is so necessary. These causal actions not only spur growth – the more your existing customers invite and convert new users – the less reliant you will be on paid acquisition strategies, thus making your marketing spend more efficient. More on that later.
Cohort Analysis
Cohort analysis follows a particular group that starts to use the product at the same time. Customers that start using a product simultaneously similarly experience its evolution. There are many advantages to following an individual cohort through their product use. When you apply specific metrics to a cohort, you create a robust profile of the cohort. So if you follow the cohort for a particular period, you will measure their use patterns and purchasing behavior. You will have a good measure of their “lifetime value,” at least up to a specific point in time. Cohort analysis is an essential practice to measure changes in product engagement.
As with any analysis, there are some best practices. First, you want to make deliberate choices about what metrics you plan to follow and for what period. You want to standardize these decisions, so compare the same elements across cohorts. Say, for example, you plan to track a cohort’s product usage weekly for six months. The cohort begins with everyone taking the same action, such as downloading an application or starting a subscription. Then, you measure their engagement behavior weekly for six months. At the end of each week, you can calculate how many customers from the initial starting population are still engaged or to what extent. This analysis lets you follow engagement and retention patterns within and across cohorts.
Network Effects
I frequently hear from founders that they plan to take advantage of network effects. They state that their product will become more valuable as more active users are acquired. Network effects can create a real competitive advantage for a new venture. But it is hard to achieve, and measuring it is not simple.
Network effects are a “critical mass” scenario created when a company’s product or service becomes more valuable as more users join or when user engagement in the network increases. Network effects may occur in certain products and services. Such effects can occur in software and marketplace-type enterprises depending on multisided connections. Companies like eBay, Airbnb, and LinkedIn become more valuable to customers the more that join. Network effects differ from virality, though they are commonly considered similar outcomes. Viral effects focus on new customer acquisition enabled through current users. In a network effect, every new user joins adds value to all other users. In a marketplace such as eBay, the more merchants sign up on the platform, the more consumers have to purchase goods. The more consumers that sign up, the more attractive it is for merchants, creating a more extensive accessible consumer base.
Measuring network effects is challenging and much depends on your business model and industry. That said, there are some metrics that, if looked at in combination, can be indicative of network effect success. For example, one metric to watch is organic growth versus paid new users. As a network grows, you will see an increase in organically acquired users. Internal sources for new users increase over those sources activated outside the network. To enhance measurement, you combine acquisition metrics with increasing retention measures. Are the rates of retention increasing from cohort to cohort? Another activity to watch is the increasing number of super users. Are you building a large customer segment of expert users who serve as advocates? Finally, you can measure marketplaces’ various aspects of the supply and demand relationship. For example, is the time it takes to find a match diminishing? In other words, are consumers finding the right product or vendor faster than earlier cohorts? Combining specific acquisition, retention, and marketplace performance measures allows founders to demonstrate that their venture is achieving positive network effects.
Metrics Through Sales Funnel Lens
Considering what metrics to apply to product performance, you should look at product development and growth through the customer lifecycle. Dave McClure and his “Startup Metrics for Pirates” initially suggested one lifecycle framework. The framework divides the product performance metrics into four areas: activation, engagement, retention, referral, or loyalty. The customer’s product engagement moves through typical phases. These phases include:
- Initial use of your product (time to value or first essential action).
- The level of engagement (DAU/WAU/MAU), retention (including churn rates and repeat purchase ratios).
- Indicators of referrals such as net promoter scores and virality rates.
In the next post, I will spend more time on funnel dynamics as we shift attention to customer engagement metrics.
Next Steps
In the next post, we will continue to explore post-launch metrics focusing on customer acquisition. In a sense, these metrics bridge product use and financial performance. Finally, I will address economic indices in an upcoming article on revenue, profitability, and funding metrics.
